
Measurement Based Care
in progress
S
Shannon Beaver
Hello,
Measurement Based Care is going to be required very soon. Please make it so we can either integrate with a seperate system like Owl.health or Blueprint Health - or allow us to create a database of assessments that we can automatically send to our clients at regular intervals and then pull reports. For example, Sally comes in with depression, I either make or choose a short depression questionaire that also has a few questions about satisifaction with treatment and then set it for Sally to receive this form every 6 weeks. Then, I can pull a report showing Sally's scores/results. The fact that IntakeQ does not have measurement based care is the one reason that I haven't purchased it. I hate to get this and then insurance companies require it and I will need to switch. Also, we can now bill for providing this to clients - meaning that we can have a passive form of income. It has been proven to improve client care and everything. It would be very, very helpful if you all could offer this.

Tyson Edwards
Hello all, we have a version one of this available. You can enable it under More > Settings > Features > Measurement-Based Care.
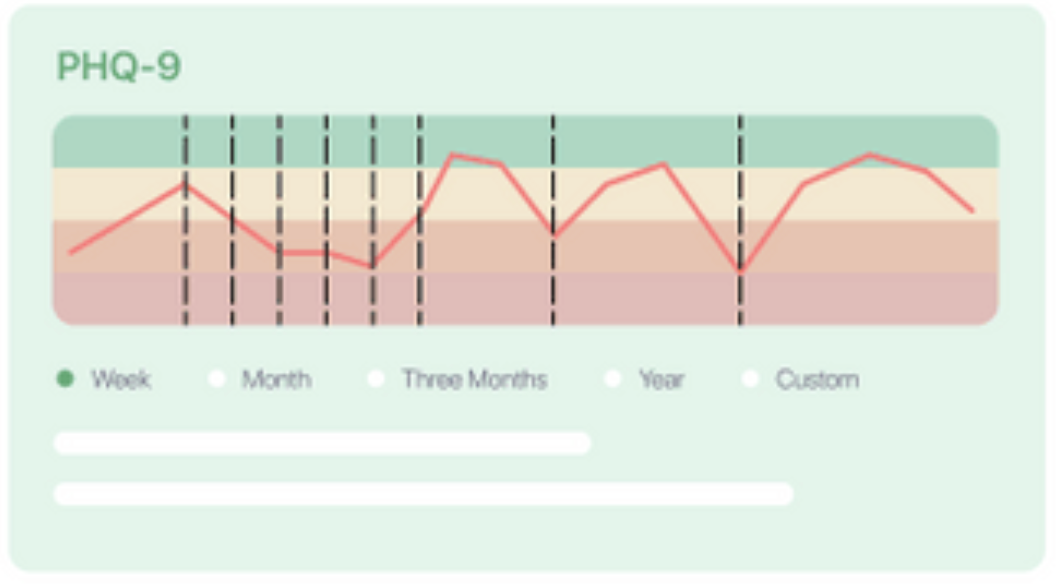
You can add ranges to a scored matrix and then see those scores plotted on a graph on a new tab in the client profile for "Progress".
Check out the article here. You can see how to set it up at the bottom here and also on the article.
https://support.intakeq.com/article/610-enabling-measurement-based-care
Set-Up:
- Go to "More > Settings > Features > Measurement-Based Care" and enable the feature
- Go to My Forms and choose the questionnaire you want graphed.
- On the matrix question type you have set to score, enable the graphing via the gear icon.
- Do this for all assessments, PHQ-9, GAD-7. You can use the "auto fill" for these.
- Once these are saved, go BACK to the Features page (More > Settings > Features> Measurement.Based Care) and click the button that says "Process All Score Enabled Questions". This will graph the scores from previously completed measures so that you can see those historic scores on the graph. Newly completed measure scores will show as they come in.
Would love to know what you think!
J
Jennifer Hill
Tyson Edwards This is such a great start! One limitation I found (maybe will be addressed in an upcoming version?) is that it only incorporates measures that are sent directly to the client (iow, the client receives a link, logs in, completes, and submits). It is not pulling data from assessment forms that are created on my end as a "note". I often need to open the form as a "note" in the client's account on my end, share my screen, and complete it with the client in session (especially for younger kids or those without access to an email account for receiving a link). It's still the same assessment, just being completed in a different way. Can it be tweaked so those assessments can be scored and included in the progress tab?
Tyson Edwards
Jennifer Hill: Sorry, you are right about this. We need to do some work to have it work for note templates. It only works for questionnaires at this time. Apologies for the confusion.
Tyson Edwards
Jennifer Hill: From the Note Templates, would you want them to be graphed when you save the note or when the note is locked?
J
Jennifer Hill
Tyson EdwardsAh, bummer. Thank you for clarifying though!
J
Jennifer Hill
Tyson Edwards I would prefer when the note is locked, if possible
M
Mone't Ince-Amara
I have been using blueprint health for 2 years but they wanted $1k to integrate with another EHR I was using.
Tyson Edwards
A
Administrator (Sonya Stalker)
I think we need additional options to corespond with the appointment date. There also needs to be a way to have a report of the findings so that progress can be measusred.
Tyson Edwards
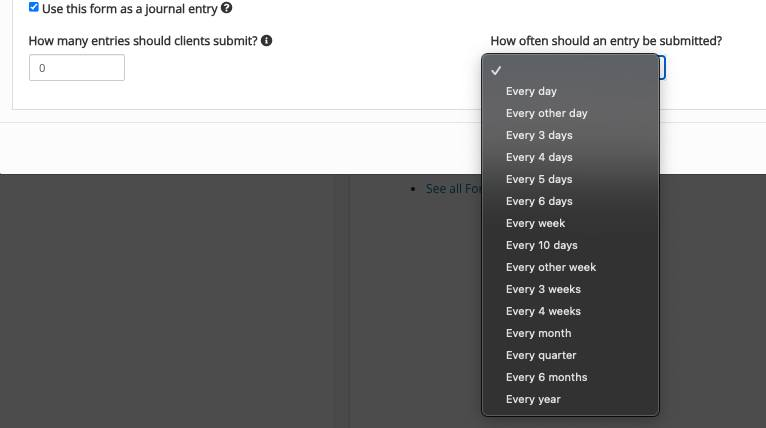
We will need to lean on the Journaling feature to send out the questionnaire's at the defined intervals.
Currently, we have these options. Will these suffice or do we need options that correspond to the appt date? (1 week before appt, 1 day before appt, etc)
A
Alison Stoner
Tyson Edwards: I depends on the measure. I think that having additional options linked to the appointment would be very helpful!
Liana Ren
Tyson Edwards,
That works, but we really need the option to graph results, as I detailed below.
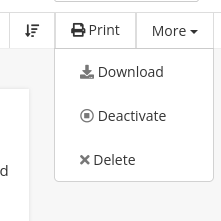
As a side note, the method to re-send a journal entry is pretty convoluted. If I click on the patient's Journal within the Timeline, and see that they haven't filled out the latest entry, there is no way to resend the most recent entry. Instead, I have to leave the patient chart, go to Lists >> Intakes, search for the patient's specific journal entry, click "View", click "... More", click "Resend Form", then click the "Resend Form" button in the popup... then I have to navigate back to the patient's chart. Talk about counterintuitive! There needs to be a way to resend a Journal entry directly from the patient chart. I would suggest the following:
Timeline >> Journal >> More >> "Resend Last Entry"
So much more intuitive!
Alternatively, you could put a button next to the "Pending" status that says "Resend Entry"
Liana Ren
We use the "Journal" feature to automatically send out some combination of PHQ-9, GAD-7, PCL-5 Abbreviated, DOCS-SF, PMQ-9, HIT-6, MVASFIQ, NPS, PDI, and MFIS assessments (depending on the patient's specific diagnoses) on a regular basis. We used the "Matrix - Single Answer per Line" question type to automatically score the assessments, so all we have to do is look at what we call their "assessment journal", and see how they have been doing over time.
It works pretty well, but as others have said, it would be really nice to be able to graph these scores over time (date as the X-axis) to more easily see their progress. It would be even more helpful if we could also see appointment dates included on the graph, that way we can get a better idea of how their progress relates to their treatments.
A limited implementation could look like a menu item under "..." (just above or below "Rules"), maybe labeled "Graph" or "MBC", that would then let you select which questions within the form you want to track over time, and also a check box with the option to show past appointments on the graph.
A more robust implementation could be a new form type under "My Forms" titled "Graphs" or "Measurement Based Care", which would then let you select the questions from other form types that you would like to track over time. For instance, maybe you automatically administer a patient PHQ-9's via a "Journal", but then you also administer them in person at their appointment; you could select the specific matrix question from the note template as well as the specific question from the "Questionnaires" (journal) template, and have all scores from both form types included in a single graph. Again, it would be good to include a check box to select something like "Show past appointments on the graph" as well, so you can show correlation between treatments and progress. It would also be good if, in addition to "Matrix - Single Answer per Line" question types, you could also graph "Numeric" field types (under "Mixed Controls"), as this could be extremely useful for tracking a patient's weight, blood pressure, or other metrics over time.
W
William Schroeder
Liana Ren while it can score, I think people are going to want to see charts similar to what you have in SimplePractice and others now. https://support.simplepractice.com/hc/en-us/articles/18314732128653-Getting-started-with-measurement-based-care
Liana Ren
William Schroeder,
I agree with you. I'm on team give us graphs. I'm a customer too, I don't work for them. I just happen to have programing experience, so I gave a very detailed request in the hopes that they use my suggestions and actually implement it in a useful way.
Tyson Edwards
in progress
Tyson Edwards
Merged in a post:
Scoring Assessments
A
Amy Kessler
Currently we can administer the PHQ-9 or the GAD-7 but the software does not score the assessment and keep track of the changes. It would be helpful for us to be able to keep track of the changes in our patients symptoms and to see a graph of their scores at each assessment date. Very simple graph or chart of the scores.
Tyson Edwards
Load More
→